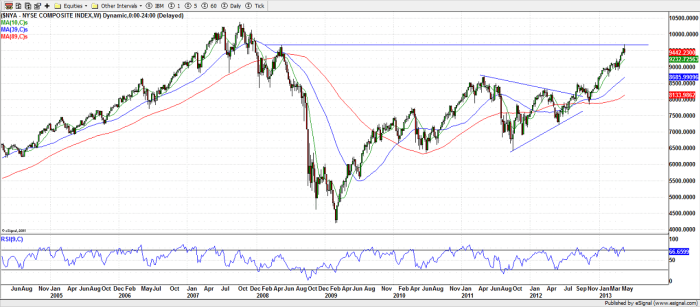
US stock market has run through many resistance levels created over the last decade and is at a very high level. Most of the broad market indices are either at all time high or much higher than the pre-financial-crisis level achieved in 2007-2008.
Dow Jones Industrial Averages, S&P 5oo are at all-time highs. So are Dow Transports and Russell 2000. Although, the NASDAQ Composite has not reached the levels seen in 2000, it crossed above high of 2007 in 2012.
Most of the exchanges are also seeing similar high with an exception of the NYSE stock exchange. The Dow Jones US Total Stock Market Index (DWCF) is at an all-time high with a chart pattern similar to S&P 500.
However, NYSE Composite Index – index of all stock traded on the NYSE exchange – has reached only the high achieved in May 2008 and is almost 10% below the all-time high of October 2007.
This indicates that the stocks listed on the NASDAQ are rising faster than the stock listed on the NYSE.


You must be logged in to post a comment.